Coors Field Park Factor — Why Colorado Breaks Baseball Stats
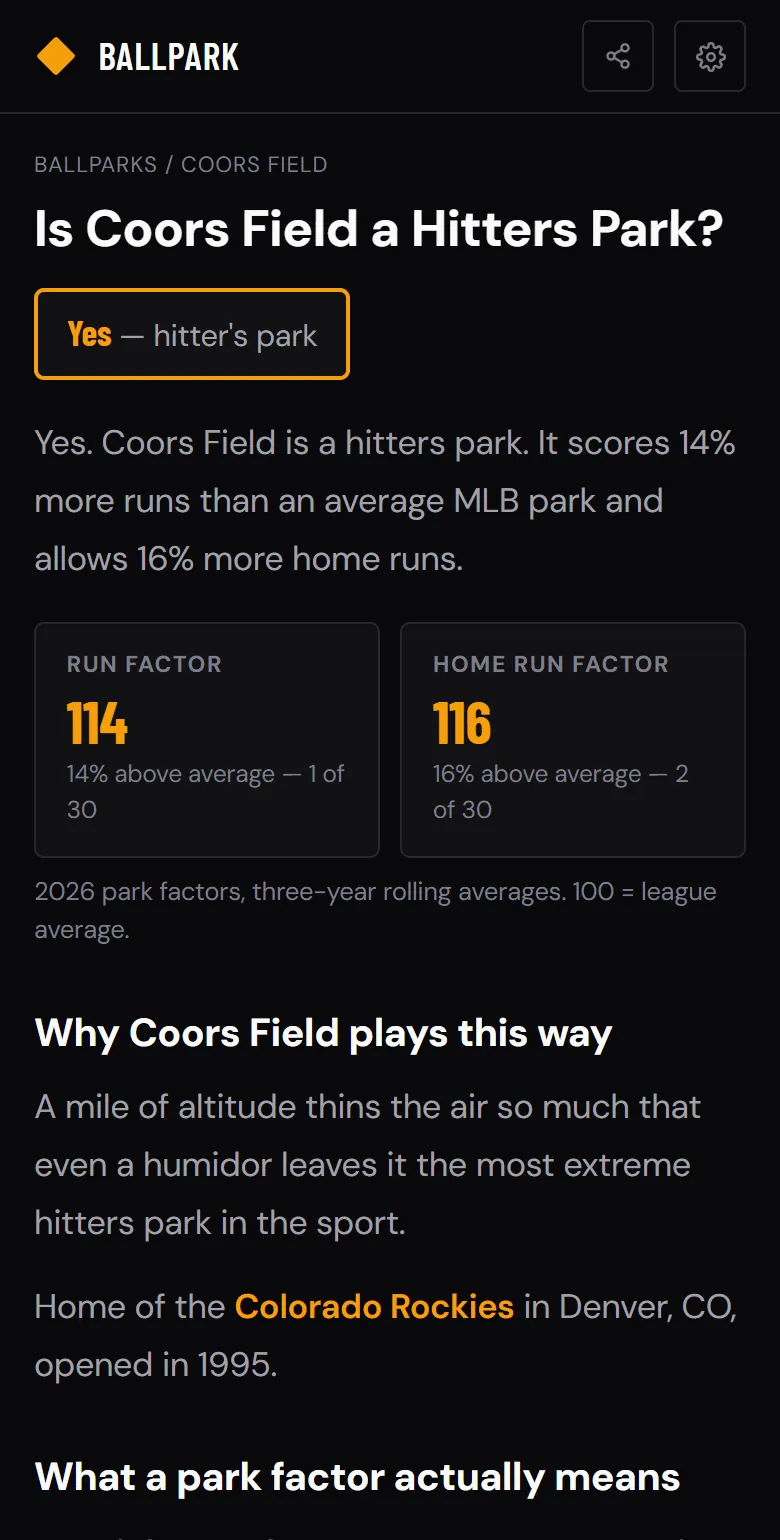
Coors Field has a park factor of 114— the highest in Major League Baseball, and it isn’t close. A 100 park factor is neutral. The next-highest park sits at 108. Coors is six points clear of the field and 22 points above the most pitcher-friendly park in the league.
That number means roughly this: run scoring at Coors runs about 14% above what the same players would produce in a neutral park.It is the single largest environmental distortion in the sport, and it means every Rockies stat line — hitter or pitcher — has to be read differently than the same line anywhere else.
This is the deep dive on one park. For all 30 ranked, see MLB Park Factors 2026.
Why Coors Field Plays This Way
Three things stack on top of each other, and only one of them is the famous one.
1. Altitude. Denver sits at 5,280 feet, where air density is roughly 15–18% lower than at sea level. Thinner air means less drag on a batted ball, so fly balls carry meaningfully farther. It also means less air resistance acting on a spinning pitch — breaking balls break less. A slider that would drop a foot at sea level drops noticeably less in Denver, which is why Coors punishes breaking-ball pitchers specifically rather than all pitchers equally.
2. The outfield is enormous.Because the Rockies knew fly balls would carry, they built the deepest outfield in baseball to keep home run totals in check. It worked — and it created a different problem. That much grass means far more balls land in front of, beside, and behind outfielders for singles, doubles, and triples. Coors leads the league in outfield square footage, and it shows up as batting average, not home runs.
3. The humidor. Since 2002 the Rockies have stored game balls in a climate-controlled humidor to counteract how dry Denver air shrinks and hardens a baseball. It genuinely reduced scoring — Coors was well above a 120 park factor before it. The 114 you see today is already the suppressed version.
What the 2026 Splits Actually Show
Park factors are multi-year averages. Here is the raw 2026 season, Rockies at home versus on the road, through August 16 — the same roster, the same players, only the ballpark changing.
Look at the last row.The Rockies hit 67 home runs in 59 games at Coors and 73 in 65 games on the road — effectively the identical rate. Meanwhile their batting average jumps 34 points and their slugging jumps 54.
This is the most misunderstood thing about Coors Field. It is not primarily a home run park. The deep outfield eats fly balls that would leave other stadiums. What Coors inflates is everything betweenthe fielders — singles that fall in, doubles into the gaps, triples that roll forever. It is a batting-average and extra-base-hit park, and treating it as a home run park will lead you wrong.
The pitching split contains the same lesson in reverse. Colorado pitchers allow the same WHIP at home and on the road— 1.51 versus 1.52, functionally identical baserunner rates. Yet their home ERA is two thirds of a run higher.
Same number of men on base, far more of them scoring. That is the park, not the pitcher. At Coors the single that would strand a runner at second instead scores him, and the double into the gap becomes a triple.
How to Read a Rockies Stat Line
The practical version: discount Colorado home numbers, and give Colorado road numbers a second look. A Rockies hitter batting .270 is roughly a league-average bat, not a good one. A Rockies pitcher with a 4.50 ERA may be doing better work than a 4.00 ERA elsewhere.
Raw OPS is the wrong tool for this comparison, and so is any single rate stat that weights on-base and slugging equally. The NUT Score is built on wOBA, which weights reaching base more heavily than OPS does. Two 2026 examples show what that changes — and what it does not:
Goodman has more OPS and 8 more home runs. Vargas still grades higher, on the strength of a .363 on-base percentage against Goodman’s .310 — OPS treats those 53 points as interchangeable with slugging, and wOBA does not.
Now add the park, because NUT does not. Goodman plays half his games at a 114 park; Vargas plays half his at Rate Field, a 104. NUT measures both against league average without discounting either venue, so the real gap between them is wider than the +1.7 and +2.6 suggest. The ballpark is context you apply on top of the number, not something already baked into it.
Neither read is dishonest — Goodman really did hit 34 home runs, and those runs really did score. But if you are asking which player produced more relative to what his environment handed him, the park has to come out of the number first.
The Coors Field Hangover
There is a long-standing theory that Rockies hitters suffer on the road beyond what park factors alone explain — that after a homestand of flat breaking balls, big-league movement at sea level looks unhittable for a few days, and the constant altitude switching wears hitters down across a season.
The 2026 road line is .238/.312/.394, which is genuinely poor. Whether that is a hangover effect or simply a roster that would be below average anywhere is not something one season of splits can settle, and honest analysts disagree about how much of the effect is real. Treat it as a live question, not a settled fact.
What is not in question is the direction. Colorado hitters are worse away from Coors and Colorado pitchers are better away from it, every year, by a wide margin.
Quick Answers
What is Coors Field’s park factor? 114 for runs and 116 for home runs, the highest marks in MLB. Neutral is 100.
Why is Coors Field so hitter-friendly? A mile of altitude thins the air so the ball carries and breaking pitches break less, and the outfield is the largest in baseball, turning fly balls into extra-base hits instead of outs.
Does the humidor still work? Yes. Coors played above a 120 park factor before the humidor was introduced in 2002. The 114 today is the reduced number.
Is Coors Field a home run park? Less than you would expect. In 2026 the Rockies homered at essentially the same rate home and away. Coors inflates batting average and doubles far more than it inflates home runs.
How much should I discount a Rockies hitter? Start from the 114 run factor above — roughly a 14% inflation to run scoring at home, so about 7% across a full schedule. Note that NUT does not do this for you: the NUT leaderboard measures production against league average and adjusts for the season’s run environment, but it carries no park term.
The Bottom Line
Coors Field is the most extreme run environment in Major League Baseball, and it distorts stat lines in a specific way that most people get slightly wrong — it is an average and extra-base-hit park far more than a home run park. A Rockies hitter’s counting stats are inflated. A Rockies pitcher’s ERA is inflated. Their WHIP, their strikeout rate, and their walk rate are much closer to honest.
The fix is not to ignore Colorado players. It is to hold the park factor in mind as a discount you apply yourself, on top of whatever production number you are reading.
Every hitter and pitcher on baseballnut.app/stats is graded on production measured against league average, updated daily. Pair it with the park factor above when the player calls one of the extremes home.