How to Find Hot and Cold MLB Hitters (Before Your League Does)
Everyone in your league can see who went 12-for-24 last week. That information is free and it is late — by the time a hot bat is obvious, the waiver claim costs you.
The edge isn’t spotting the hot streak. It’s telling which hot streaks are real.Most aren’t. A week is 25 plate appearances, and 25 plate appearances is small enough that luck can carry a player to a .400 average with nothing underneath it.
Here is how to read a seven-day sample properly, which slumps to ignore, and how to check both in about thirty seconds.
Why Batting Average Is the Worst Way to Spot a Hot Hitter
A seven-day batting average tells you how often a hitter got a hit. It doesn’t tell you whether he earned them.
Two hitters both go 10-for-25 — a .400 week. The first hit four home runs and drew four walks. The second hit ten singles, several of which found grass between fielders. Identical batting averages. Completely different weeks. The first is showing skill that repeats. The second is showing batted-ball luck that regresses, usually fast.
So the question to ask about any hot streak is not how many hits but where the production came from. Three things separate signal from noise:
1. Power. Home runs and extra-base hits are the most repeatable thing in a small sample. A hitter can get lucky on ground balls finding holes. He cannot get lucky into four home runs.
2. Walks. Plate discipline stabilizes faster than almost any other skill. A hot week with walks in it usually reflects a hitter seeing the ball well. A hot week with zero walks is more often good fortune on balls in play.
3. Strikeouts. A hitter raking and striking out less than usual is making more contact, not just better contact. That combination is the strongest one-week signal there is.
What a Real Hot Streak Looks Like
Here is the top of the seven-day board through August 16, with the shape of each week attached. Watch how differently these read once you look past the hit total.
Alonso is the cleanest signal on the board.Fourteen hits, four home runs, four walks — power and discipline together. That is a hitter genuinely locked in, not a hitter getting bounces.
Now compare Grisham and Díaz.Díaz has more hits (13 to 10) and a better average. Grisham grades higher. Grisham hit four home runs to Díaz’s two, and the extra-base damage is worth far more than three additional singles. If you were picking off batting average alone, you’d take the wrong one.
Carroll is the sneaky one.Only eight hits in 22 at-bats — a .364 week that looks ordinary next to the others. But two homers and four walks in a short week means he reached base a lot and did damage when he connected. That profile tends to hold up.
Which Cold Streaks to Ignore
The cold board is where leagues are actually won, because most managers overreact to it. Here is the bottom of the same seven days:
Ride out the slumps of good hitters. Elly De La Cruz went 2-for-26 and still drew three walks. A week that bad from an established hitter is noise, and dropping him is how you hand your league a star for nothing. The rule of thumb: a bad week from a good player is a bad week. A bad month from a good player is a conversation.
The cold list is more useful as a buy-low board than a drop list. The manager holding De La Cruz after a 2-for-26 week is the most gettable he will be all season.
Where a cold streak does matter is when a marginal player’s bad week comes with no walks and no power at all — that is a hitter losing playing time soon, not a hitter due for a bounce.
The Thirty-Second Version
Doing this by hand across 400 hitters every week isn’t realistic, which is why the Hot & Cold page exists. It ranks every hitter, pitcher, and team by NUT Score over the last seven days — a single number that already weighs power, walks, and contact the way this article describes, measured against league average.
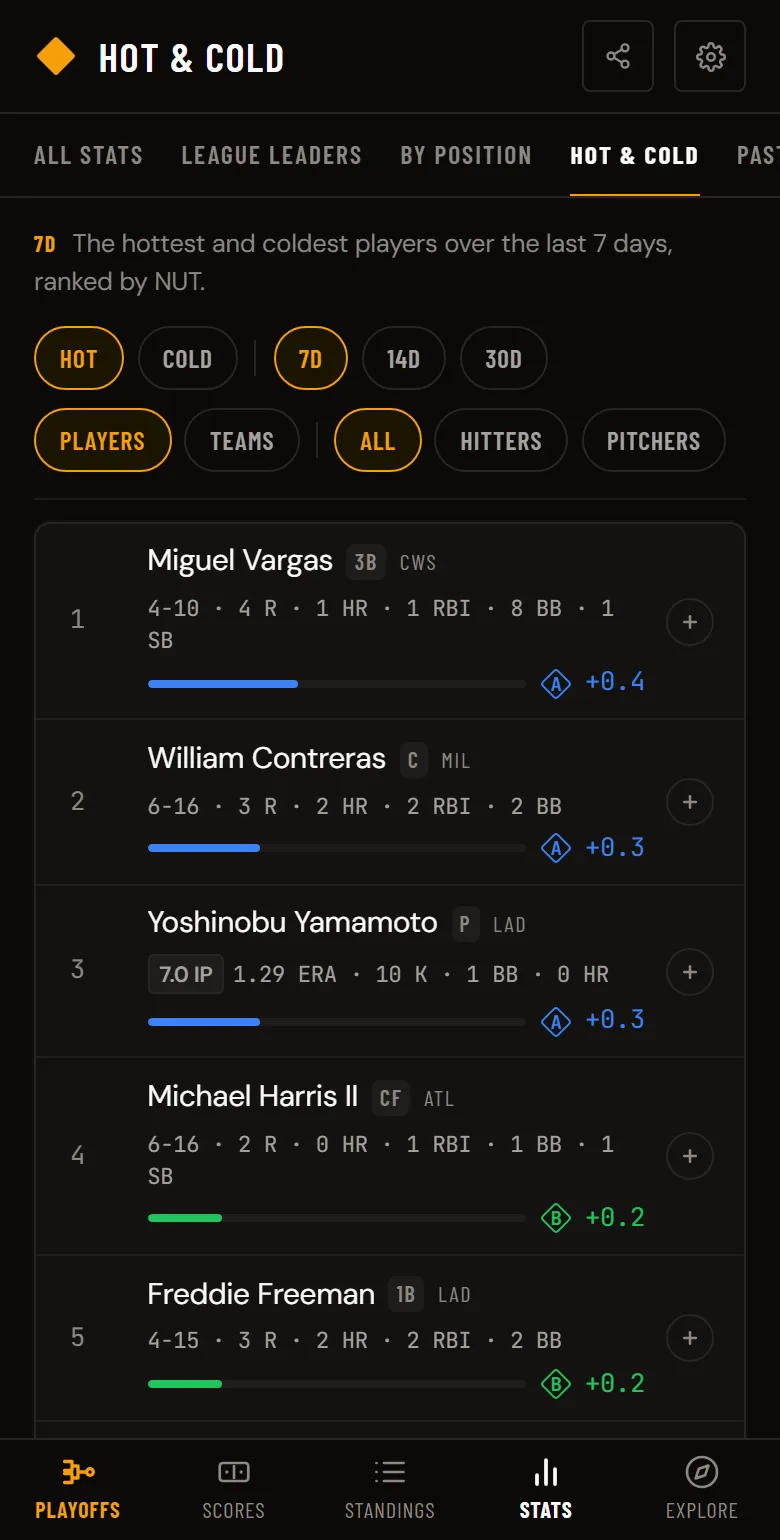
1. Open baseballnut.app/trending. It opens on hot hitters by default.
2. Toggle Hot / Cold to flip between the risers and the slumping. Cold is your buy-low list.
3. Switch Players / Teams and Hitting / Pitchingto narrow it. Team view is useful for streaming — a whole lineup running hot means the opposing starter is in trouble.
4. Tap any name to see the full profile, then add them to your Watchlist so you can follow the streak without hunting for them again.
5. For a longer view, the Hot & Cold page switches to 14 and 30 days with one tap. If a player is hot on the 7-day board andthe 30-day board, that is no longer a streak — that is a level change, and those are the pickups worth spending on.
Common Questions
How long does a hot streak have to be before it means something?For power, a week of home runs is real production even if it doesn’t predict the next week. For batting average, seven days predicts almost nothing — check the 30-day board before paying up.
Should I drop a star after a bad week? No. One week is roughly 25 plate appearances. Established hitters have multiple 2-for-25 weeks every season without anything being wrong.
What’s the best single stat for spotting a hot hitter?Not batting average. You want something that weighs extra-base hits and walks rather than counting hits equally — that is precisely what NUT does over any window you pick.
Does this work for pitchers? Yes, with a different lens. Pitcher NUT is built on strikeouts, walks, and home runs with defense removed, so a pitcher trending up is showing his own skill rather than the fielding behind him.
The Bottom Line
Hot streaks are easy to find and hard to trust. The ones worth acting on have power and plate discipline underneath them; the ones that burn you are built on singles that happened to land. Cold streaks are the opposite trap — the instinct to cut a slumping star is almost always wrong, and the manager who panics is the one you should be trading with.
The hot and cold boards refresh daily at baseballnut.app/trending— hitters, pitchers, and teams, over the last seven days.